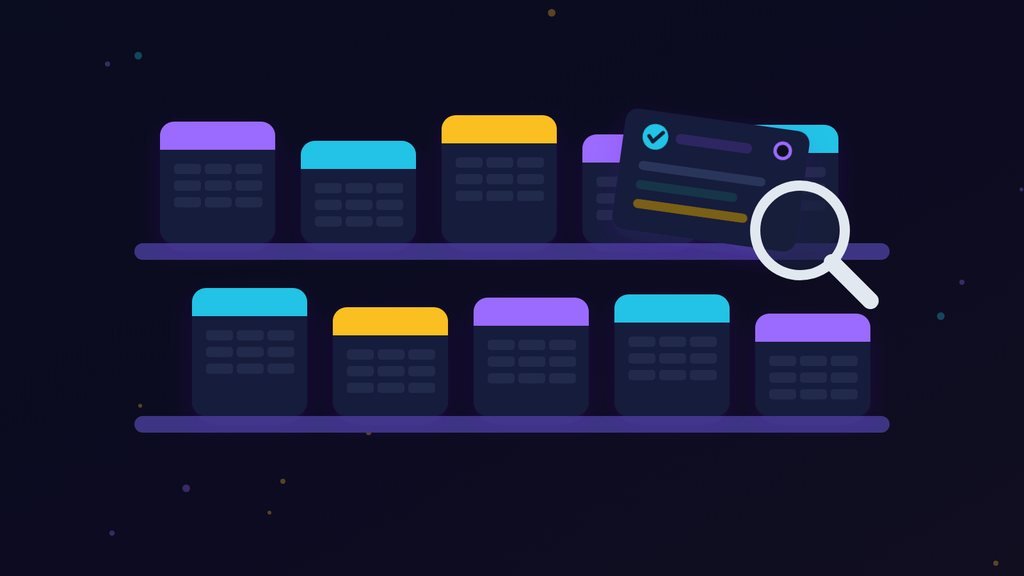
Shelf Life: A Tour of the Datasets Library
Here is a table of agricultural exports. It lives in the LucidPlexus datasets library, next to a short master list of the countries it is supposed to mention, in case anybody forgets.
Ask the table itself which countries it holds, though, and it tells a different story. We ran this in DuckDB on the CSV the library serves:
SELECT DISTINCT Country
FROM ag_exports
ORDER BY Country;
We’re not going to print what came back. How many countries that query returns is one of the automatic checks in the Can I Trust This Data? guided project, and nobody likes the friend who shouts the ending. The gist will do: the list comes back longer than the master list, because some countries, it turns out, go by more than one name.
So is the library broken? The answer is the most useful thing on the shelves, and it’s waiting at the end of the tour.
What’s on the shelves
Start with the size of the place. The library holds more than a hundred datasets and, between them, more than two hundred thousand rows; the counter at the top of the page keeps a running total of rows and downloads. Pills across the top filter by domain, and the search box reads titles and descriptions. Some entries are a single CSV; many are collections of several files under one name, like HealSync’s six hospital tables or AgriSphere’s ten farm files.
Business is the longest shelf by a distance, roughly a quarter of the library, with property, people, marketing and startup data among it. Finance and production come next, then sales, accounting, environment and technology, with shorter shelves for science, health and agriculture. One tip that will save you some scrolling: the list runs oldest first, so the newest arrivals sit on the last page. It’s a library that shelves its new releases at the back.
And some of those new arrivals wear a tick. Right now, the ticked entries are the 32 tables behind the five field books: Clearstone’s books, HealSync’s hospital, the Verdant Union’s environment, Lanternfield’s startup applications and the agricultural tables you met at the top. Each is a single table, and each comes with a label that starts by saying what one row is.
Opening a dataset
Click any title and you get its page. Everyone can read it: the size of the table, its files, its columns with a type and a sample value, and which guided projects use it.
To download, you need an account, and a free one is enough once its email is confirmed; no invitation required. Then each file gets a Preview button that shows its first eight rows on the page, a Download button, and the rail offers every file at once as a ZIP. Previews don’t count as downloads, so you can peek without guilt. With an account you can also bookmark a dataset from the list and come back to it later.
Two parts of the page are easy to miss and worth a look. Related datasets lists a few others from the same domain, newest first; on Clearstone’s budget page, that currently means the rest of its books. And published repos built on this dataset shows finished, human-reviewed work by members who used the same table, which is the quickest way to see what the data can do before you touch it.
From shelf to workspace
This is where guided projects come in, and where most of the library gets its exercise. Every brief lists its datasets in scope, each with an alias: the name you’ll type in your queries. Follow the Money’s four are budget, receivables, cash_flow and departments; Green on Paper brings twelve.
When a Community member claims a brief, the workspace loads those tables under their aliases, ready for SQL (DuckDB) and Python (pandas), both running in the browser, so the data never leaves it. A Profile & Quality panel profiles each table for you with DuckDB’s SUMMARIZE (types, missing values, distinct counts, minimum, average and maximum) plus a count of duplicate rows. Nobody types those numbers in; they’re computed every time.
Is the library broken, then?
The countries with more than one name, then. Open the Agricultural Exports page and read the label. It says, in as many words, that this is a teaching copy: the rows as supplied, plus exact duplicates, variant country spellings, impossible tonnages and blank years, all added on purpose, with a count beside each. We checked every count against the file, and they’re all there.
Every ticked table hands you its own charge sheet.
It names the offences and counts them, and it leaves the finding to you, on purpose. Clearstone’s budget warns that one line has a negative amount and that deciding what to do with it is part of the job. Its departments table admits that one department has no budget lines at all: a left join finds it, an inner join hides it. The Verdant Union’s air-quality table confesses to stations that write their dates their own way. A few labels do name names (two HealSync claims, 1014 and 1038, appear twice), and one is almost smug about it: Clearstone’s cash movements say nothing is planted at all, and the finding is in the sums.
If you’d rather have the lot in one go, the Library’s Practice Dataset Pack holds the same CSVs as these Community datasets: 32 tables and 12,653 rows, with a README of hints for each book’s faults, 83 in all. The answers sit at the end, below a line you’re allowed to stop reading at.
Out in the wild
Which is the catch. Most data you’ll meet at work arrives with no label at all. Nobody tells you that a country goes by several names, or that some rows forgot their year.
On the next table nobody has labelled, what will you look for first?
References
- Community datasets library — Browse by domain, preview and download with a free account.
- Can I Trust This Data? (guided project) — The agricultural tables, profiled, cleaned and checked in seventeen tasks.
- Follow the Money (guided project) — Clearstone’s four tables in one notebook.
- All guided projects — Every brief with its datasets in scope.
- Explore published work — Human-reviewed repos, many built on these datasets.
- Practice Dataset Pack — All 32 ticked tables in one zip, with hints and answers.
- Data Quality Checks in SQL — A check for each dimension of data quality, written on the agricultural tables.
- Can I Trust This Data? (book) — The field book these agricultural tables were built for.
- Pick a World: A Tour of the Five Field Books — Where the ticked tables come from.
- DuckDB documentation: Summarize — What SUMMARIZE computes for each column.
Related Magazine Stories
Magazine
Are We Done Yet? A Guided Project, Claim to Certificate
|

Magazine
Pick a World: A Tour of the Five Field Books
|

Magazine
Receipts, Please: What Changed on LucidPlexus This Month
|
Comments
No comments yet. Be the first to share your thoughts.