The Worst Year for Late Payers Hasn’t Happened Yet
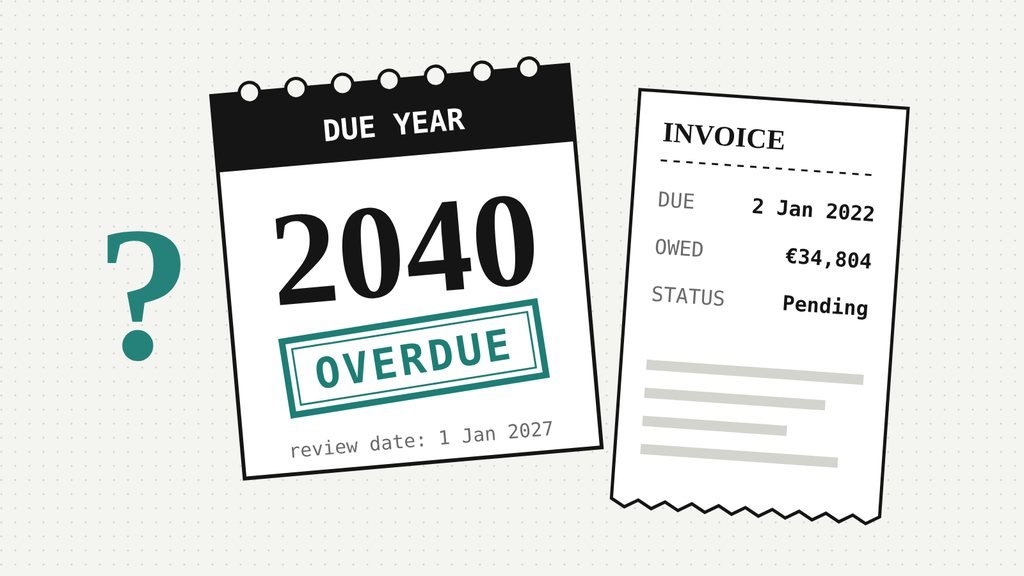
Clearstone’s worst year for late payers, according to its own ledger, is 2040.
Clearstone, before anyone phones their accountant, is made up. Its books are practice data on LucidPlexus: a budget, a record of cash, five departments and a ledger of 1,000 invoices, built to look like a real finance team’s files, mess included, so that learners can practise on something with teeth. The ledger has one invoice a week, each with what a customer owes Clearstone, what Clearstone owes a supplier, a due date and a status.
receivables1,000 rows · 4 columns · CSV →CREATE TABLE receivables AS SELECT * FROM read_csv('receivables.csv'); It is the same file this article used, faults included, so your results will match ours.So we brought it the question every finance director gets round to asking: when does our cash pressure peak? The first query most of us would write groups the invoices marked overdue by the year they fall due:
SELECT year(due_date)         AS year_due,
       COUNT(*)               AS invoices,
       SUM(receivable_amount) AS labelled_overdue
FROM receivables
WHERE payment_status = 'Overdue'
GROUP BY year_due
ORDER BY labelled_overdue DESC
LIMIT 3;| year_due | invoices | labelled_overdue |
|---|---|---|
| 2040 | 19 | 644,001 |
| 2030 | 20 | 598,510 |
| 2037 | 21 | 579,825 |
Clearstone’s customers, it seems, are planning to be late thirteen years ahead. Most of us can’t plan a dentist’s appointment that far out. Drawn as a chart, the full result looks worse still.
Overdue is two dates, not one word
So the label is a rumour: most of what it calls Overdue isn’t even due on the date the books are reviewed to, 1 January 2027. Overdue is two facts, unpaid and past due, and the query needs that review date pinned as a literal to stand on, not CURRENT_DATE, which hands you a different answer every morning:
SELECT year(due_date)         AS year_due,
       COUNT(*)               AS invoices,
       SUM(receivable_amount) AS overdue
FROM receivables
WHERE payment_status <> 'Paid'
  AND due_date < DATE '2027-01-01'
GROUP BY year_due
ORDER BY year_due;| year_due | invoices | overdue (€, rounded) |
|---|---|---|
| 2022 | 28 | 739k |
| 2023 | 34 | 923k |
| 2024 | 31 | 709k |
| 2025 | 34 | 746k |
| 2026 | 32 | 898k |
By the dates, about €4.0 million is overdue, and the year it piles up most is 2023, which at least has the decency to be in the past. (The overdue-by-date amounts in this article are rounded: the exact figures are yours to find in the Follow the Money guided project, where they’re the answers its checks look for.)
So cash pressure peaked in 2023? Not quite. That table answers “which year’s invoices are unpaid?”, and the question was when the pressure peaks. Pressure isn’t one year’s slice. It’s the whole pile, on the day you look at it.
Ask on more than one day
Here’s the move that turns one number into a history: treat the review date as a parameter, and ask the same question on many dates. DuckDB’s generate_series builds the dates, one every six months, and a join with an inequality in it (due_date < as_of_date) attaches every unpaid invoice to every review date it was already late on.
WITH as_of AS (
  SELECT CAST(d AS DATE) AS as_of_date
  FROM generate_series(DATE '2022-07-01', DATE '2027-01-01',
                       INTERVAL 6 MONTH) AS t(d)
)
SELECT a.as_of_date,
       COUNT(r.due_date)             AS still_unpaid,
       SUM(r.receivable_amount)      AS overdue
FROM as_of AS a
LEFT JOIN receivables AS r
       ON r.due_date < a.as_of_date
      AND r.payment_status <> 'Paid'
GROUP BY a.as_of_date
ORDER BY a.as_of_date;| as_of_date | still_unpaid | overdue (€, rounded) |
|---|---|---|
| 2022-07-01 | 16 | 379k |
| 2023-01-01 | 28 | 739k |
| 2023-07-01 | 43 | 1,179k |
| 2024-01-01 | 62 | 1,662k |
| 2024-07-01 | 77 | 1,944k |
| 2025-01-01 | 93 | 2,371k |
| 2025-07-01 | 112 | 2,780k |
| 2026-01-01 | 127 | 3,117k |
| 2026-07-01 | 145 | 3,667k |
| 2027-01-01 | 159 | 4,016k |
Before reading anything into that last column, notice the one thing it can’t do: go down. The ledger holds each invoice’s status as it stands today, not the day it was paid, so “unpaid now and due before the review date” can only grow as the review date moves later. An invoice paid late in 2024 was overdue in 2023 and simply isn’t there. A line that rises every time is built into the method, so it proves nothing. What the method can show is how steeply it rises.
And the slope is steady: about €0.8 million for every year of due dates, with no year far out of line. A crisis would show up as a bump. This is a ramp, and the question it raises is the one the slide can’t answer, because it can’t see payments: does late money ever come in?
Do late payers ever pay?
If they did, you could see it without a single payment date. An invoice that fell due five years ago has had five years to be paid; one that fell due in November has had a few weeks. Customers who pay late, but do pay, leave the old invoices mostly settled and the young ones mostly open. So take every invoice that has fallen due, group it by how long ago, and count what’s still unpaid:
SELECT CASE
         WHEN DATE '2027-01-01' - due_date <= 365  THEN '0-1 years'
         WHEN DATE '2027-01-01' - due_date <= 730  THEN '1-2 years'
         WHEN DATE '2027-01-01' - due_date <= 1095 THEN '2-3 years'
         WHEN DATE '2027-01-01' - due_date <= 1461 THEN '3-4 years'
         ELSE '4-5 years'
       END                                       AS overdue_for,
       COUNT(*)                                  AS fell_due,
       COUNT(*) FILTER (WHERE payment_status <> 'Paid') AS unpaid,
       ROUND(100.0 * COUNT(*) FILTER (WHERE payment_status <> 'Paid')
             / COUNT(*), 1)                      AS pct_unpaid
FROM receivables
WHERE due_date < DATE '2027-01-01'
GROUP BY overdue_for
ORDER BY overdue_for;| overdue_for | fell_due | unpaid | pct_unpaid |
|---|---|---|---|
| 0-1 years | 52 | 32 | 61.5 |
| 1-2 years | 52 | 34 | 65.4 |
| 2-3 years | 52 | 31 | 59.6 |
| 3-4 years | 53 | 34 | 64.2 |
| 4-5 years | 52 | 28 | 53.8 |
Now read the last column from top to bottom: 61.5, 65.4, 59.6, 64.2 and 53.8 per cent. Invoices that have had five years to be paid are about as likely to be unpaid as invoices that have had one. The very first quarter of the ledger, January to March 2022, still has 9 of its 13 invoices unpaid. The last quarter of 2026 has 6 of 13.
In this ledger, late and never look exactly alike.
That changes how to read the €4.0 million. Taken at face value, it’s sediment rather than a queue of payments on their way: each year of due dates has left between €0.71 million and €0.92 million behind, and nothing in the ledger suggests any of it has moved since. About €3.1 million, more than three-quarters of the pile, is over a year late. On that reading, Clearstone’s cash pressure doesn’t peak at all; it accumulates.
- Pin the as-of date in the query, as a literal or a parameter.
CURRENT_DATEmakes every report unrepeatable. - Work status out from the dates. Treat the label as a claim to test, not a column to sum.
- Before you call something a peak, slide the as-of date, and remember that a snapshot of today’s statuses can only pile up as you slide it.
-- DuckDB: subtract the dates
DATE '2027-01-01' - due_date

-- SQLite: dates are text, so go through julianday()
julianday('2027-01-01') - julianday(due_date)
Date arithmetic is a dialect. We ran every query here in DuckDB 2.0.0 and cross-checked the overdue totals and the age table in SQLite 3.45.1; both gave the same numbers.
The other explanation
There is a second way to read Fig. 3, and the ledger lends it plenty of support. Look at how the three labels are spread on either side of the review date:
SELECT CASE WHEN due_date < DATE '2027-01-01'
            THEN 'fallen due' ELSE 'not yet due' END AS side,
       COUNT(*) AS invoices,
       ROUND(100.0 * COUNT(*) FILTER (WHERE payment_status = 'Paid')
             / COUNT(*), 1) AS pct_paid,
       ROUND(100.0 * COUNT(*) FILTER (WHERE payment_status = 'Pending')
             / COUNT(*), 1) AS pct_pending,
       ROUND(100.0 * COUNT(*) FILTER (WHERE payment_status = 'Overdue')
             / COUNT(*), 1) AS pct_overdue
FROM receivables
GROUP BY side
ORDER BY side;| side | invoices | pct_paid | pct_pending | pct_overdue |
|---|---|---|---|---|
| fallen due | 261 | 39.1 | 32.2 | 28.7 |
| not yet due | 739 | 31.0 | 35.3 | 33.7 |
Paid covers 39% of the invoices that have fallen due and 31% of those that haven’t, some of which aren’t due until 2041. Each label covers roughly a third on both sides of the line. A status column that looks much the same for last year’s invoices and for ones fourteen years off isn’t tracking payments closely, and a team that keeps it like that might never change Pending to Paid when a late payment finally lands.
If so, part of that €4.0 million is already in Clearstone’s bank under the wrong word, and Fig. 3 is a picture of a spreadsheet nobody updates. If not, it’s money the company will never see, sitting on the balance sheet as though it might turn up.
The ledger can’t tell those two stories apart. The bank statement could, but it isn’t in the files. So which is it at Clearstone: cash that never came, or cash that came and nobody wrote down?
References
- Clearstone — Invoices (Community dataset) — the ledger this article queried, every planted fault still in it.
- Follow the Money (Academy course) — the full course on these four tables: SQL from the first query, ageing, cleaning decisions and the finance scorecard.
- Follow the Money (guided project) — seventeen tasks with automatic checks on the same ledger.
- Follow the Money (Library) — the field book behind the course and the project.
- Finance Metrics in SQL (cheat sheet) — overdue by the due dates against the status label, and ageing, on Clearstone’s books.
- Dates in SQL (cheat sheet) — date differences, generate_series calendars and “as of” questions in four databases.
- DuckDB 2.0 documentation: FILTER clause — restricting one aggregate to some rows, as in COUNT(*) FILTER (WHERE …).
- DuckDB 2.0 documentation: Date functions — subtracting one DATE from another.
- DuckDB 2.0 documentation: Timestamp functions — generate_series as a table function over timestamps with an interval step.
- SQLite: Date and time functions — julianday() and date arithmetic on text dates.
Related essays
▱
Data quality
|

▱
SQL
|
▱
SQL
|
Comments
No comments yet. Be the first to share your thoughts.